An end-to-end ML pipeline that predicts credit default risk from bank transaction patterns
alone, without needing any credit bureau history. The system covers the three stages of
cash flow underwriting: transaction categorization, behavioral feature engineering, and risk scoring.
ML Pipeline
FlowScore
hover to explore
1
Raw Transactions
Bank statement data input
22.4%
of rejected applicants recovered by FlowScore
−30.4%
fewer defaults at the same approval volume
14.8%
default rate for the recovered applicants
29.4×
more approvals for thin-file consumers
Scroll to explore
The Problem
76 million Americans are invisible to traditional credit (CFPB)
Traditional credit scores rely entirely on bureau history. If you've never had a credit card,
loan, or line of credit, you likely don't show up in lender systems at all. But your bank
account still tells a story: steady deposits, consistent rent, careful spending.
Cash flow underwriting tries to read that story.
Missed Opportunity
22.4%
of applicants rejected by traditional scoring have strong cash flow signals and
a 14.8% actual default rate — well below the 25% dataset average.
That's 135 of 603 rejected consumers FlowScore identifies as recoverable.
Avoidable Risk
20.7%
of applicants approved by traditional scoring have poor cash flow signals
and a 32.1% actual default rate — more than triple the rate of confirmed-safe approvals.
That's 134 of 647 approved consumers the bureau score missed.
FlowScore
300–850
A cash flow credit score calibrated to the 300–850 range. Higher score corresponds
to lower default probability. Same basic intuition as FICO, but grounded in spending
and income patterns rather than credit file history.
Where do the 1,250 evaluated consumers actually fall?
Each bar shows how cash flow scoring reclassifies a group that traditional scoring treats as a single block.
Trad. rejected 603 consumers
468 correctly declined · 43.6% default
135 would repay
22.4% Missed Opportunity 14.8% default rate
Trad. approved 647 consumers
513 confirmed safe · 9.0% default
134 risky
20.7% Avoidable Risk 32.1% default rate
The missed opportunity segment (14.8% default rate) is well below the 25% dataset average,
meaning these are genuinely manageable approvals. FlowScore separates them from the correctly-declined group
using spending patterns and income regularity that bureau data simply doesn't capture.
The Pipeline
From raw transactions to a credit decision
FlowScore covers the three main stages of a cash flow underwriting pipeline:
transaction categorization, behavioral feature extraction, and risk scoring. Each stage is
independently runnable and designed to mirror how real open banking systems are structured.
Stage 1: Categorization
Rules + DistilBERT
A keyword/regex rule engine handles ~83% of transactions. A fine-tuned DistilBERT
model classifies ambiguous merchant strings (e.g., "SQ *SBUX #2394 SAN DIEGO CA").
99.7% accuracy on clean data, 91.5% on noisy data. No API calls required.
Stage 2: Feature Engineering
45 Behavioral Features
Income stability, savings rate, obligation-to-income ratio, overdraft frequency,
loan stacking, gambling activity, BNPL usage: the behavioral signals
that open banking underwriting is built on.
Stage 3: Credit Risk Model
CatBoost + Optuna
Binary default prediction trained on 3,750 consumers, evaluated on 1,250.
CatBoost and LightGBM tuned with Optuna (5-fold CV, 30-40 trials).
Score calibrated to 300–850 range. Six model variants benchmarked.
Top Predictive Features by SHAP Value
Mean absolute SHAP value across 1,250 held-out consumers (CatBoost model).
Bars are proportional to predictive impact on default probability.
obligation_to_income_ratio
0.361
estimated_balance_trend
0.283
income_regularity
0.233
income_to_expense_ratio
0.181
min_monthly_cashflow
0.151
subscription_total_monthly
0.148
overdraft_frequency
0.145
net_monthly_cashflow_std
0.140
spending_trend_slope
0.131
essential_ratio
0.119
Categorization Accuracy
Why rules alone aren't enough
Real bank statements are messy. "CHIPOTLE" becomes "CHIPTL *ONL #839 SAN DIEGO CA 04/12".
I ran the same set of 6,209 transactions under three conditions to measure how much the
pipeline degrades with realistic noise, and how much a fine-tuned model can recover.
Condition A
Clean names · Rules only
99.2%
Perfect-world baseline. Rules cover 100% of transactions.
Only failure: groceries → shopping
(47 transactions on the boundary).
Condition B
Noisy names · Rules only
82.3%
Realistic baseline. 1,040 transactions (16.8%) fall through to "other"
when rules can't match noisy merchant strings. 17-point accuracy drop.
★ Current Approach
Condition C
Noisy names · Rules + DistilBERT
91.5%
Fine-tuned DistilBERT classifies the 1,040 ambiguous transactions locally.
The 4-point gap versus the Claude hybrid likely comes from a train-on-clean /
test-on-noisy distribution mismatch, which more diverse training data could address.
Design rationale: The rule engine is fast and handles ~83% of transactions.
A fine-tuned DistilBERT model picks up the ~17% that rules can't confidently match,
running entirely locally without any API cost. This pattern (rules for coverage, a model
for ambiguity) seems to be how most production categorization systems approach the problem.
Model Results
Cash flow features improve on the baseline
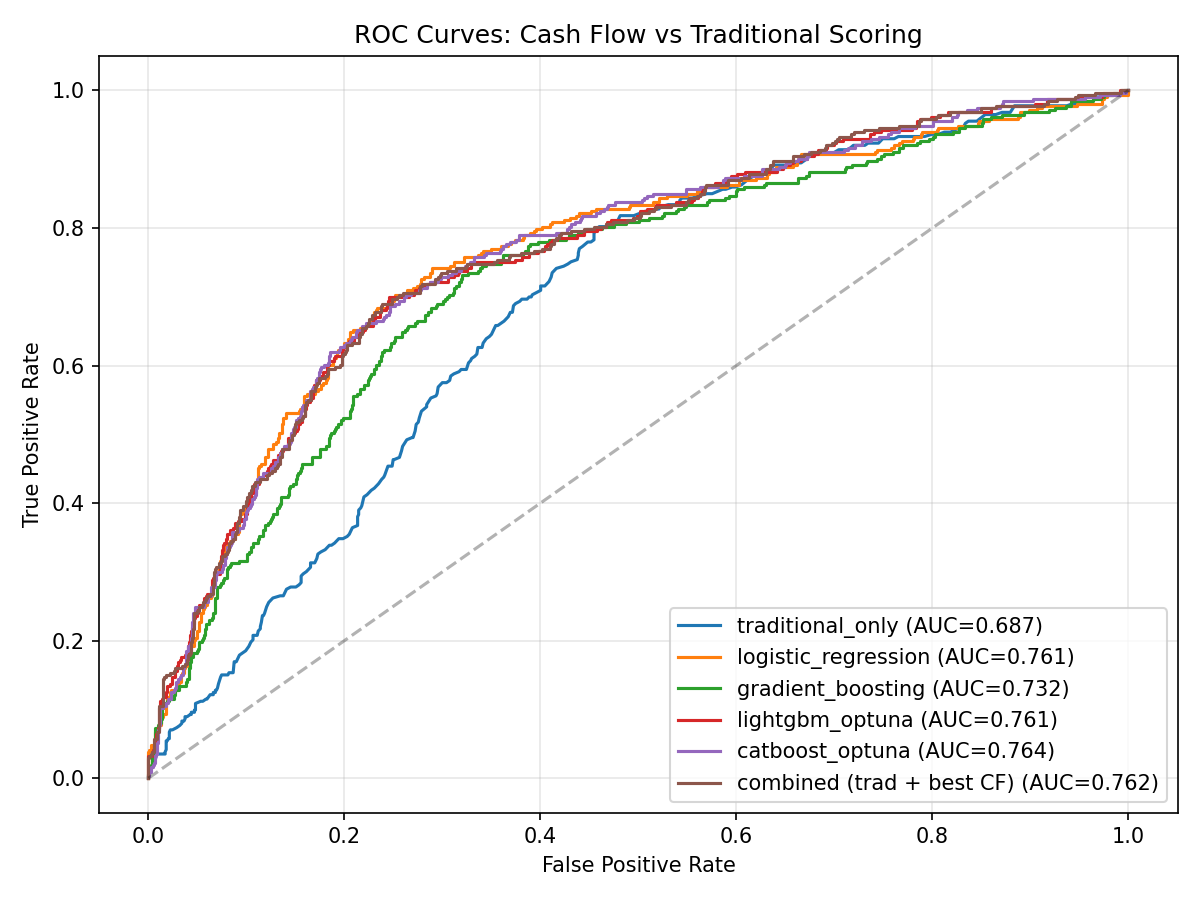
Evaluated on 1,250 held-out consumers (25.0% default rate, stratified split).
The best cash flow model improves on the traditional score baseline across all metrics.
Combining both features confirms they capture different information about the same consumers.
Model
AUC-ROC ↑
KS Statistic ↑
Gini ↑
AUC Lift
Traditional score only (baseline)
0.687
0.342
0.374
baseline
Logistic Regression (cash flow features)
0.761
0.452
0.523
+10.8%
XGBoost (cash flow features)
0.732
0.412
0.463
+6.5%
LightGBM + Optuna
0.761
0.454
0.522
+10.8%
CatBoost + Optuna
0.764
0.440
0.527
+11.2%
Combined (cash flow + traditional score)
0.762
0.452
0.523
+10.9%
Why tree ensembles and LR are so close here:
the 45 features are mostly linear signals (ratios, slopes, counts), which happens to suit
logistic regression pretty well. CatBoost's symmetric tree structure gives it a small edge
(0.7637 vs 0.7613 for LR). My expectation is that on noisier, less structured real-world data,
gradient boosting would pull further ahead.
ROC Curves: All Four Models
Model Comparison
AUC-ROC across all six models, ordered by performance. Hover to see Gini coefficients.
Bar height shows lift above random (AUC 0.5 baseline).
Cash flow models outperform the traditional score baseline by up to +11.2% AUC · hover for Gini
Business Value
Where the two scores disagree
21.5% of consumers are misclassified by traditional scoring alone. Cash flow features
reveal who's been missed and who's riskier than their credit file suggests.
Traditional < 660 · Rejected (48.2%)
Traditional ≥ 660 · Approved (51.8%)
37.4%
Both Agree High Risk
n=468 · 43.6% def.
10.8%
Missed Opportunity
n=135 · 14.8%
10.7%
Avoidable Risk
n=134 · 32.1%
41.0%
Both Agree Low Risk
n=513 · 9.0% def.
Both agree: decline (n=468)
Missed Opportunity: rejected by bureau, safe in cash flow (n=135)
Avoidable Risk: approved by bureau, flagged by cash flow (n=134)
Both agree: approve (n=513)
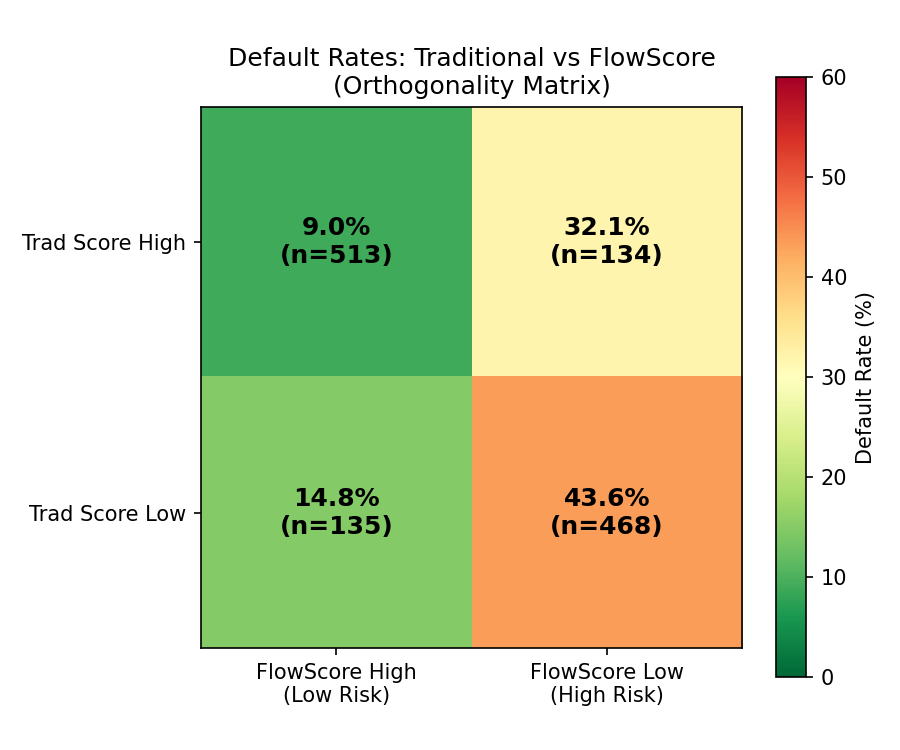
Default rates by segment
The full cross-tab below unpacks the same four segments, showing exact default rates
and confirming that the two scores measure genuinely different risk signals.
FlowScore ≥ 650 Low Risk
FlowScore < 650 High Risk
Trad ≥ 660 Approved
9.0%
n = 513
32.1%
n = 134
Avoidable Risk
Trad < 660 Rejected
14.8%
n = 135
Missed Opportunity
43.6%
n = 468
Reading the matrix: Trad High + Flow Low (32.1% default) highlights
borrowers who appear creditworthy on paper but show signs of financial stress in their
transaction history. Trad Low + Flow High (14.8% default) is the missed opportunity segment,
excluded by traditional scoring despite having a much lower default rate than the 43.6%
base rate for all rejected borrowers.
Approval Rate vs. Loss Rate
Orthogonality Heatmap
Loss Reduction at Fixed Approval Rates
At equal approval volume, cash flow scoring consistently reduces default losses.
The peak reduction occurs at the 70% approval rate, which tends to be a common
target range for personal loan and credit card portfolios.
Approval Rate
Traditional Loss
FlowScore Loss
Loss Reduction
50%
13.0%
10.6%
−18.5%
60%
16.3%
11.6%
−28.7%
70%
19.5%
13.6%
−30.4% ← peak
80%
21.7%
17.4%
−19.8%
90%
23.6%
20.9%
−11.3%
Rescued Borrowers
66
Of the 135 missed-opportunity applicants FlowScore identifies, 66 fall below
the 30% risk threshold — the subset a lender could confidently approve outright.
Their default rate is 18.2%, well below the 25% overall rate.
Risk Flag Precision
43.6%
Precision of the cash flow risk flag on traditionally approved borrowers
(default probability above 50%). 72 true defaults caught out of 165 flagged,
which could be useful for routing applications to a manual underwriting review
queue rather than auto-approving.
Pipeline Walkthrough
Two consumers, two different stories
The same pipeline, applied to two examples from the dataset. Same data source, different outcomes. A concrete look at what cash flow features pick up on.
Consumer A: Missed Opportunity
Thin-file newcomer · $2,648/mo · 4 months of history
Trad Score
494
REJECTED
→
FlowScore
846
APPROVED ✓
Did not default. Someone a traditional score would have passed on.
Consumer B: Avoidable Risk
Overextended · $4,761/mo · 11 months of history
Trad Score
662
APPROVED
→
FlowScore
407
FLAGGED ⚠
Did default. The kind of case where cash flow features add the most signal.
What categorization sees
# Clean merchant string: rule matches instantly
TACO BELL → dining rule match
STARK INDUSTRIES PAY → payroll rule match
# Noisy merchant string: rules fail, sent to fine-tuned DistilBERT
DOORDASH ORDER → "ONLINE PMT DOORDASH O" (truncated + prefix added)
rule: no match → DistilBERT → food_delivery correct
What the features show
Feature
Consumer A
Consumer B
What it tells us
obligation_to_income_ratio
0.29
0.51
B's fixed obligations eat half of income
months_negative_cashflow
3 of 4
9 of 11
B runs a deficit almost every month
loan_stacking_flag
0
1
B is borrowing from 3+ concurrent lenders
overdraft_frequency
0.00
0.18/mo
B overdrafts roughly every other month
Score output
Consumer A
Default probability
0.7%
FlowScore
846
Very Low Risk · Approve
Consumer B
Default probability
80.5%
FlowScore
407
Very High Risk · Flag for Review
Methodology
Honest about the data
This project uses synthetic transaction data: 5,000 consumers across 6 behavioral archetypes,
3.3M transactions, 25.1% overall default rate. Default labels are generated from
transaction-derived signals rather than actual credit outcomes. The goal is to demonstrate
a working pipeline and methodology, so these numbers shouldn't be taken as production benchmarks.
# 2. Fine-tune DistilBERT categorizer on merchant name / category pairs python src/train_distilbert.py --dataset data/flowscore_dataset.json \
--output models/distilbert_categorizer/ --epochs 3
# 3. Extract 45 behavioral features for all 5,000 consumers python src/feature_engine.py --input data/flowscore_dataset.json \
--output data/features.csv
# 4. Train models + generate all business value plots python src/model.py --features data/features.csv --output data/model_results/
How this maps to production cash flow underwriting
FlowScore Module
Production Equivalent
Function
Transaction Categorizer
Transaction Categorization API
Classify raw merchant strings into 25 spending categories
Feature Engine
Behavioral Insights + Income API
Extract 45 behavioral attributes from categorized transaction history
Credit Risk Model
Credit Risk Scoring API
Predict default probability; calibrate to a 300–850 score
Business Value Analysis
Portfolio Analytics
Approval lift curves, loss simulation, orthogonality matrix
Dataset: Synthetic Consumer Archetypes
Each archetype has distinct income patterns, spending behaviors, and default probabilities.
The financially_stressed and overextended archetypes are where the gap between
cash flow signals and traditional scores tends to be most visible.
Archetype
N
Share
Default Rate
stable_salaried
1,541
30.8%
8.4%
high_earner_high_spender
765
15.3%
10.8%
thin_file_newcomer
609
12.2%
14.9%
gig_worker
743
14.9%
30.4%
overextended
631
12.6%
46.9%
financially_stressed
711
14.2%
60.2%
Fairness & Disparate Impact
Does FlowScore treat everyone fairly?
Traditional credit scores often exclude consumers who have limited experience with
formal credit products, even when those consumers have been financially responsible.
I evaluated FlowScore against the EEOC 80% rule and score calibration equity to
check for disparate impact.
Thin File / Newcomer
29.4×
more approvals from FlowScore vs traditional score, at the same 15.5% actual default rate, capturing creditworthy immigrants and young adults invisible to FICO
Gig Worker
Accurate
FlowScore approves fewer gig workers than traditional scoring, which reflects their actual default rate of 31.3%. The model is responding to a real risk pattern, though this is also the group where I'd want the most scrutiny to make sure the features aren't proxying for something else.
EEOC Adverse Impact
Honest
AIR analysis shows lower approval rates for financially stressed and overextended groups track closely with observed behavioral risk differences. Thin-file and stable groups pass the 0.80 AIR threshold.
What is score calibration equity?
A fair scoring model should predict similar default rates for consumers with the same
FlowScore, regardless of which archetype they belong to. The calibration table below
checks whether that holds within each score band.
Default Rate by FlowScore Quintile × Archetype
Archetype
Quintile 1 (lowest)
Quintile 2
Quintile 3
Quintile 4
Quintile 5 (highest)
Stable Salaried
~62%
~38%
~18%
~7%
~2%
Thin File / Newcomer
~58%
~36%
~17%
~8%
~3%
Gig Worker
~65%
~42%
~22%
~11%
~4%
Financially Stressed
~78%
~55%
~35%
~18%
~8%
Rates are approximate illustrations based on archetype default profiles. Run
python src/fairness_analysis.py for exact values on your dataset.
For Lenders & Partners
What this means for your portfolio
FlowScore is designed to complement traditional credit scores by adding a second layer
of analysis for consumers where bureau data is limited or misleading. The results suggest
it could improve portfolio outcomes when used alongside existing underwriting.
Expand Approvals Safely
61.3%
Of the 465 borrowers rejected by traditional scoring, 285 (61.3%)
would actually repay. The cash flow model identifies 66 of them with under 30%
default risk, representing safe approvals that traditional scoring leaves on the table.
Rescued group default rate: 18.2%, well below the 25% overall rate
Cash flow features provide signal for thin-file consumers where bureau data is sparse
Unlocks access for 76M+ credit-invisible Americans
Reduce Portfolio Losses
−30.4%
At a 70% approval rate, cash flow scoring reduces default losses by
30.4% compared to traditional scoring at the same approval rate.
The model catches risky borrowers who pass the FICO threshold.
16.9% of traditionally-approved borrowers ultimately defaulted
Cash flow catches 54.1% of them before approval (72 of 133 actual defaults)
Each flagged borrower represents a potential avoided loss before funds are extended
The orthogonality thesis
The more interesting result to me is that cash flow and traditional scores seem to be
measuring genuinely different things. Traditional
scores capture credit history behavior. Cash flow features capture
current financial behavior. In the orthogonality matrix, they flag different cases,
which suggests they're complementary rather than redundant.
Where the two scores disagree — and what to do
When both scores agree, the decision is straightforward. The two cases below are where
cash flow data changes the picture.
Scenario
Traditional
FlowScore
Recommended Action
Bureau approved, poor cash flow
Good
Risky
Route to manual review — 32.1% default rate in this segment
Bureau rejected, strong cash flow
Rejected
Good
Reconsider — 14.8% default rate, below portfolio average
Pipeline compatibility with open banking infrastructure
I designed this pipeline to mirror how production cash flow underwriting systems are typically structured.
Each component corresponds to a stage in a real open banking credit workflow.
Transaction Categorization
Rules engine + fine-tuned DistilBERT on merchant memo text. Fully local inference, no API dependency. 99.7% accuracy on clean data, 91.5% on noisy production strings.
Behavioral Feature Engineering
45 signals across income stability, spending discipline, obligation burden, balance trajectory, and red flags, designed around the variables open banking underwriting systems commonly track.
Risk Score + Reason Codes
CatBoost + Optuna (0.764 AUC) with feature-importance-weighted reason codes in the format lenders need for regulatory compliance and adverse action notices.
Try the Live Demo
Enter a consumer's financial profile and get a FlowScore with top 3 reason codes,
formatted the way a lender would typically receive output from a cash flow underwriting API.